Dfinity Logo Dfinity Historical Price Chart

Website: https://dfinity.org/

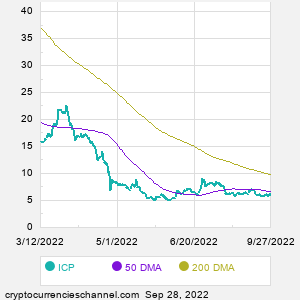
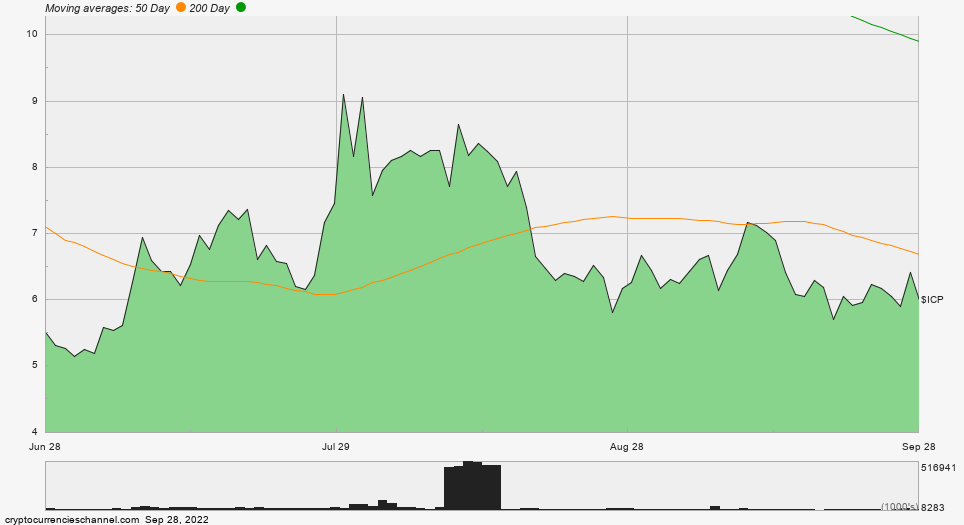
Description: The Internet Computer blockchain only recently launched but developer and entrepreneurial activity is exploding, and so are the active users of their emerging dapps and services. On this page, we present various Dfinity historical price chart visualizations.
As of date:9/27/2022
Dfinity price:6.01
Dfinity 50 DMA:6.66
Dfinity 200 DMA:9.86
Dfinity MACD (200-50):3.20
Dfinity RSI:43.49
Extremely
Overbought
Overbought/Oversold RSI Range
RSI Indicator (Relative Strength Index)43.49
Extremely
Oversold
As of:9/28/2022 8:20EST
Dfinity price:$5.97
Coin volume:16.12M
Change:-0.34
%Change:-5.46%
Today's high:$6.02
Today's low:$5.89
52 week high:$54.77
52 week low:$5.29
Coins outstanding:262.20M
Market cap:1.57B

Dfinity DMADfinity MACD

Dfinity One Month Historical Price Chart

Dfinity One Month Historical Price Chart

Dfinity One Quarter Historical Price Chart

Dfinity One Quarter Historical Price Chart

Dfinity One Year Historical Price Chart

Dfinity One Year Historical Price Chart


Featured Crypto Articles

4/18/2024
Prologis vs. BNB: Price Relationship Crosses Threshold

4/18/2024
Direxion Shares ETF Trust - Daily Small Cap Bull 3X Shares Now the Least Expensive vs. BNB This Year

4/18/2024
ProShares Trust - UltraPro Russell 2000 Now the Least Expensive vs. BNB This Year

4/17/2024
Buying Power of Bitcoin vs. Direxion Shares ETF Trust - Daily MSCI Brazil Bull 2X Shares at New 52-Week High

4/16/2024
Comparing XRP Versus MandT Bank Reveals New High

4/16/2024
Litecoin vs. ProShares Ultra Silver: Price Relationship Crosses Threshold

4/16/2024
Comparing XRP Versus ProShares Ultra Gold Reveals New High


Recent Dfinity Related News

4/18 - 2:00 PM
The DeFi Report Releases the Ethereum Network's Q1 Earnings Results

4/18 - 11:01 AM
WiMi Announced an Efficient Connectivity Solution Based on Blockchain Lightweight Architecture 5G IoT

4/18 - 10:56 AM
Canaan Shines at Blockchain Life 2024 in Dubai

4/18 - 10:54 AM
Canaan Shines at Blockchain Life 2024 in Dubai

4/18 - 10:01 AM
OKX and HKUST Partner to Conduct First-of-its-Kind Zero-Knowledge Blockchain Technology Research in Hong Kong

4/18 - 8:13 AM
The Halvening Heralds a New Blockchain Economy for Miners

4/18 - 8:06 AM
CoinEx Presents Beachside Soirée: Uniting Blockchain Industry Leaders and Influencers at Token 2049 Dubai

4/18 - 8:01 AM
CoinEx Presents Beachside Soirée: Uniting Blockchain Industry Leaders and Influencers at Token 2049 Dubai

4/18 - 7:36 AM
DeFi Technologies Subsidiary Valour Inc. Launches the First Short Spot Bitcoin ETP in the Nordics

4/18 - 7:31 AM
DeFi Technologies Subsidiary Valour Inc. Launches the First Short Spot Bitcoin ETP in the Nordics

4/18 - 6:18 AM
Flash News: OKX to Give Away 150 Nervape Bonelist NFT Spots

4/17 - 10:36 PM
Flash News: OKX Partners with OverProtocol to Launch Airdrop Event on Cryptopedia

4/17 - 12:37 PM
New Mega Dice Website Ushers in GameFi SOL Token Crypto Presale For Next-Gen Gamification

4/17 - 11:06 AM
Canadian securities regulators provide update on interim approach to value-referenced crypto assets

4/17 - 11:01 AM
Flash News: OKX to Give Away 200 Phaver-Up NFT Whitelist Spots

4/17 - 11:01 AM
Canadian securities regulators provide update on interim approach to value-referenced crypto assets

4/17 - 9:06 AM
Rho Labs and CoinDesk Indices join forces to offer CESR™, a standard benchmark for Ethereum staking

4/17 - 9:01 AM
EY launches OpsChain Contract Manager solution to support secure private business agreements on public Ethereum

4/17 - 9:00 AM
Security Alliance (SEAL) Launches Free, Crypto-Native ISAC

4/17 - 7:36 AM
DeFi Technologies Subsidiary, Valour, Forges Strategic Collaboration with Core Foundation to Launch Innovative Bitcoin ETPs

4/17 - 7:31 AM
DeFi Technologies Subsidiary, Valour, Forges Strategic Collaboration with Core Foundation to Launch Innovative Bitcoin ETPs

4/17 - 6:49 AM
Northstake Announces Tokenized Staking on Ethereum Testnet with 3iQ, CoinFund and CoinDesk Indices

4/17 - 1:06 AM
Bybit Report: Exchanges Have Only Nine Months Supply at Current Prices Before Bitcoin Halving

4/17 - 1:00 AM
Bybit Report: Exchanges Have Only Nine Months Supply at Current Prices Before Bitcoin Halving

4/16 - 5:01 PM
Staking Pools Now Available on the Xai Blockchain, Primed to Reward Users and Foster Network Innovation


Stocks Versus Digital Assets

iShares Trust - iShares 1-3 Year Treasury Bond ETF (SHY) Vs. Crypto
Vanguard Sector Index Funds Vanguard Health Care ETF (VHT) Vs. Crypto
SPDR Series Trust - S&P Dividend ETF (SDY) Vs. Crypto
The Materials Select Sector SPDR Fund (XLY) Vs. Crypto
Vanguard Scottsdale Funds - Vanguard Mortgage-Backed Securities ETF (VMBS) Vs. Crypto
SPDR Index Shares Fund - Portfolio Developed World ex-US ETF (SPDW) Vs. Crypto
Vanguard World Fund - Mega Cap Growth Exchange Traded Fund (MGK) Vs. Crypto


Dfinity Historical Price Chart FAQ

What is the recent price quote for Dfinity?
How much is one Dfinity in US dollars?

✔️Accepted answer: As of 9/27/2022, one coin trades at about 6.01 US dollars for Dfinity.

Is Dfinity oversold or overbought?
Using the RSI indicator, where does Dfinity stand?

✔️Accepted answer: For digital asset traders who incorporate Technical Analysis into their strategies, one of the popular historical price chart tools is the Relative Strength Index (RSI). This popular indicator, originally developed for stock market analysis in the 1970's by J. Welles Wilder, looks at a 14-day moving average of an asset's gains on its up days, versus its losses on its down days. The result is a value that measures momentum, oscillating between "oversold" and "overbought" on a scale of zero to 100. A reading below 30 is viewed to be oversold, which a bullish investor could look to as a sign that the selling is in the process of exhausting itself, and look for entry point opportunities. A reading above 70 is viewed to be overbought, which could indicate that a rally in progress is starting to get crowded with buyers. If the rally has been a long one, that could be a sign that a pullback is overdue. We calculate the current RSI value for Dfinity to be 43.49 as of 9/27/2022.

What is the current DMA for Dfinity?
DMA meaning daily moving average, with Dfinity historical price chart moving average periods of 50 and 200?

✔️Accepted answer: One of the popular technical analysis tools is to calculate a Simple Moving Average (SMA), with a look-back of either a shorter or longer term period — with popular periods being the 50 day moving average ("50 DMA") for the shorter period, and the 200 day moving average ("200 DMA") for the longer period. We calculate the current 50 DMA for Dfinity to be 6.66, and the current 200 DMA for Dfinity to be 9.86 as of 9/27/2022.

What is Dfinity's MACD based on its DMA values?
MACD referring to the moving average convergence / divergence indicator.

✔️Accepted answer: For the 50 DMA and 200 DMA discussed above, the current MACD is 3.20 based on the Dfinity historical price chart as of 9/27/2022.


Dfinity Historical Price Chart | www.CryptocurrenciesChannel.com | Copyright © 2021 - 2024, All Rights Reserved


Nothing in CryptocurrenciesChannel.com is intended to be investment advice, nor does it represent the opinion of, counsel from, or recommendations by BNK Invest Inc. or any of its affiliates, subsidiaries or partners. None of the information contained herein constitutes a recommendation that any particular security, portfolio, transaction, or investment strategy is suitable for any specific person. All viewers agree that under no circumstances will BNK Invest, Inc,. its subsidiaries, partners, officers, employees, affiliates, or agents be held liable for any loss or damage caused by your reliance on information obtained. By visiting, using or viewing this site, you agree to the following Full Disclaimer & Terms of Use and Privacy Policy. Stock quote data delayed at least 15 minutes; stock quote data powered by Ticker Technologies and Mergent.