Ethereum Logo Ethereum Historical Price Chart

Website: https://ethereum.org/en/

Description: Ethereum is a technology that's home to digital money, global payments, and applications. The community has built a booming digital economy, bold new ways for creators to earn online, and so much more. It's open to everyone, wherever you are in the world – all you need is the internet. On this page, we present various Ethereum historical price chart visualizations.
As of date:9/25/2023
Ethereum price:1592.81
Ethereum 50 DMA:1678.61
Ethereum 200 DMA:1806.13
Ethereum MACD (200-50):127.52
Ethereum RSI:52.95
Extremely
Overbought
Overbought/Oversold RSI Range
RSI Indicator (Relative Strength Index)52.95
Extremely
Oversold
As of:9/26/2023 5:45EST
Ethereum price:$1,593.84
Coin volume:728,175
Change:+17.61
%Change:+1.12%
Today's high:$1,594.52
Today's low:$1,588.14
52 week high:$2,113.57
52 week low:$1,143.75
Coins outstanding:120.23M
Market cap:191.62B

Ethereum DMAEthereum MACD

Ethereum Today

Ethereum Intraday Price Chart

Ethereum One Month Historical Price Chart

Ethereum One Month Historical Price Chart

Ethereum One Quarter Historical Price Chart

Ethereum One Quarter Historical Price Chart

Ethereum One Year Historical Price Chart

Ethereum One Year Historical Price Chart

Ethereum Five Year Historical Price Chart

Ethereum Five Year Historical Price Chart


Featured Crypto Articles

9/26/2023
Comparing Dogecoin Versus Invesco Bulletshares 2025 Corporate Bond Etf Reveals New High

9/26/2023
Comparing Dogecoin Versus Invesco Bulletshares 2026 Corporate Bond Etf Reveals New High

9/26/2023
Ishares Ibonds Dec 2026 Term Corporate Etf Now the Most Expensive vs. Dogecoin This Year

9/26/2023
First Trust Tcw Unconstrained Plus Bond Etf Now the Most Expensive vs. Dogecoin This Year

9/26/2023
Dogecoin vs. Invesco Variable Rate Preferred Etf: Price Relationship Crosses Threshold

9/26/2023
Ishares Ibonds Dec 2027 Term Corporate Etf Now the Most Expensive vs. Dogecoin This Year

9/26/2023
Buying Power of Dogecoin vs. iShares Trust - iShares MSCI Europe Financials ETF at New 52-Week Low

9/26/2023
Dogecoin vs. Invesco Bulletshares 2025 High Yield Corporate Bon: Price Relationship Crosses Threshold

9/25/2023
Cintas Now the Most Expensive vs. BNB This Year

9/25/2023
BNB Now Buys You the Least Amount of CMS Energy in the Past Year

9/25/2023
BNB vs. JB Hunt Transport Servs: Price Relationship Crosses Threshold

9/25/2023
Vanguard Bond Index Funds - Short Term Bond ETF Now the Most Expensive vs. BNB This Year

9/25/2023
BNB vs. SPDR Gold Trust: Price Relationship Crosses Threshold

9/25/2023
Cardano vs. Vanguard Scottsdale Funds - Vanguard Short-Term Corporate Bond ETF: Price Relationship Crosses Threshold

9/25/2023
BNB vs. Vanguard Scottsdale Funds - Vanguard Short-Term Treasury Index ETF: Price Relationship Crosses Threshold

9/25/2023
Comparing BNB Versus iShares Trust - iShares Short Treasury Bond ETF Reveals New High

9/24/2023
Cardano vs. World Gold Trust: Price Relationship Crosses Threshold

9/24/2023
Comparing Cardano Versus Ishares International Aggregate Bond Fund Reveals New High

9/24/2023
Cardano Now Buys You the Least Amount of Vanguard Ultra-short Bond Etf in the Past Year

9/24/2023
Comparing Cardano Versus Blackrock Short Maturity Bond Etf Reveals New High

9/24/2023
Comparing Cardano Versus Ishares Ibonds Dec 2024 Term Corporate Etf Reveals New High

9/24/2023
Cardano vs. SPDR Series Trust - Bloomberg Investment Grade Floating Rate ETF: Price Relationship Crosses Threshold

9/24/2023
Cardano vs. iShares Trust - iShares 0-5 Year Investment Grade Corporate Bond Exchange Trade Fund: Price Relationship Crosses Threshold

9/24/2023
Comparing Cardano Versus Invesco Actively Managed Exchange Traded Fund Trust - Ultra Short Duration ETF Reveals New High

9/24/2023
Invesco Exchange-Traded Fund Trust II - Global Clean Energy ETF vs. Bitcoin: Price Relationship Crosses Threshold


Recent Ethereum Related News

9/26 - 4:01 AM
Wirex and Onramper teamed up to offer access to cryptocurrencies in over 190 countries through 120+ payment methods

9/25 - 7:55 PM
BingX Announces Strategic Sponsorship for Dubai Future Blockchain Summit 2023

9/25 - 5:55 PM
Wall Street Memes Price Expected to Rocket on OKX Exchange Listing - Largest New Crypto Launch of 2023

9/25 - 8:59 AM
Viral and Quantelica: The Vanguard and Blackrock of Cryptocurrency Ecosystems

9/21 - 3:36 PM
Is New Crypto Presale Meme Kombat The Next 100x Stake to Earn Gaming Meme Coin?

9/21 - 3:25 PM
Trace Labs Integrating Trusted AI with OriginTrail for Blockchain Wire

9/21 - 1:22 PM
TG.Casino Crypto Gaming Token Presale Raises $150,000 in a Flash, Earn 3,000% APY With Next Telegram Bot to Explode

9/21 - 1:01 PM
Global Casinos Strategic Business Report 2023-2030: The Growing Role of Internet and Mobile Technologies, Blockchain and Cryptocurrency Bring in Cashless Transactions

9/21 - 10:35 AM
Deepcoin Labs Receives Crypto-commodities Trading Registration from DMCC & Launches $10 Million Fund

9/21 - 10:00 AM
Lumerin Hashpower Marketplace Launches, Delivering Peer-to-Peer Trading of Bitcoin Mining Capacity

9/21 - 9:06 AM
dxFeed Launches Innovative "Faces of the Crypto Market" Index Family to Define Cryptocurrency Market Dynamics

9/21 - 9:06 AM
Virtualness Secures Additional Funding from Global Investor Base, and Leverages Generative AI and Blockchain to Launch Gratitude OnChain

9/20 - 2:16 PM
Global Blockchain IoT Business Report 2023: Market to Reach $14.9 Billion by 2030 with Software & Platforms Accounting for $10.2 Billion

9/20 - 11:06 AM
ASC alleges Edmonton resident Devon Christopher Edwards and KB Crypto Inc. breached Alberta securities laws

9/20 - 11:01 AM
ASC alleges Edmonton resident Devon Christopher Edwards and KB Crypto Inc. breached Alberta securities laws

9/20 - 10:05 AM
Cryptocurrency Mining Hardware Market to Reach $5,020.35 Million, Globally, by 2032 at 11.4% CAGR: Allied Market Research

9/20 - 8:34 AM
Aly Madhavji Celebrated in London Daily News' 40 Under 40 for Revolutionizing the Blockchain Space

9/19 - 10:16 PM
Global Cryptocurrency Mining Research Report 2023-2028: Evolutions in Hardware Technology Fostering Growth

9/19 - 9:11 AM
Briya Raises $11.5M Series A, Accelerates U.S. Rollout of Blockchain-Secured Data Exchange Platform to Enhance Collaboration Between Hospitals and Life Sciences

9/19 - 9:00 AM
Provenance Blockchain and Axelar Integrate for Global Access to Real-World Assets

9/19 - 8:52 AM
VITREUS: A Newcomer is Taking AI and Blockchain Innovation to the Next Level

9/19 - 8:38 AM
Securing the Future: QuickLogic and Xiphera Partner to Pioneer Post-Quantum Cryptography on eFPGAs

9/19 - 6:01 AM
XRP Healthcare List on MEXC strategically positioning itself for imminent Crypto Bull Run

9/18 - 2:31 PM
CBC Summit addressing banking and compliance challenges for the crypto industry kicks off next week

9/18 - 1:30 PM
Unchained Powers Bitcoin-Backed Private Credit Fund in Partnership with Build Asset Management


Stocks Versus Digital Assets

Johnson and Johnson (JNJ) Vs. Crypto
PepsiCo (PEP) Vs. Crypto
Costco Wholesale (COST) Vs. Crypto
Walmart (WMT) Vs. Crypto
Coca-Cola (KO) Vs. Crypto
Thermo Fisher Scientific (TMO) Vs. Crypto
Cisco Systems (CSCO) Vs. Crypto


Ethereum Historical Price Chart FAQ

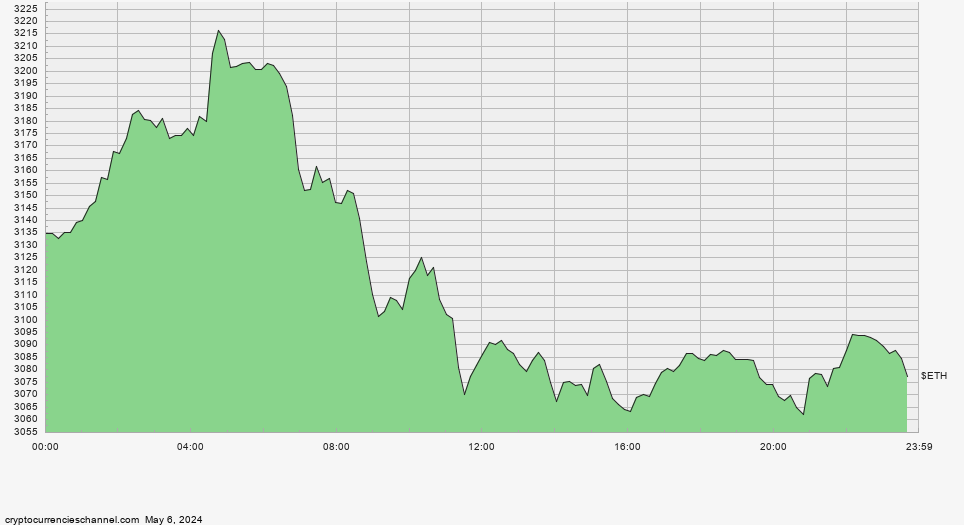
What is the recent price quote for Ethereum?
How much is one Ethereum in US dollars?

✔️Accepted answer: As of 9/25/2023, one coin trades at about 1592.81 US dollars for Ethereum.

Is Ethereum oversold or overbought?
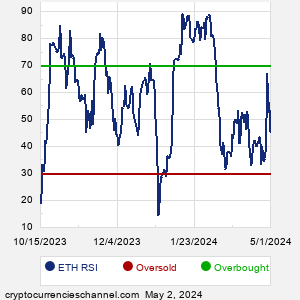
Using the RSI indicator, where does Ethereum stand?

✔️Accepted answer: For digital asset traders who incorporate Technical Analysis into their strategies, one of the popular historical price chart tools is the Relative Strength Index (RSI). This popular indicator, originally developed for stock market analysis in the 1970's by J. Welles Wilder, looks at a 14-day moving average of an asset's gains on its up days, versus its losses on its down days. The result is a value that measures momentum, oscillating between "oversold" and "overbought" on a scale of zero to 100. A reading below 30 is viewed to be oversold, which a bullish investor could look to as a sign that the selling is in the process of exhausting itself, and look for entry point opportunities. A reading above 70 is viewed to be overbought, which could indicate that a rally in progress is starting to get crowded with buyers. If the rally has been a long one, that could be a sign that a pullback is overdue. We calculate the current RSI value for Ethereum to be 52.95 as of 9/25/2023.

What is the current DMA for Ethereum?
DMA meaning daily moving average, with Ethereum historical price chart moving average periods of 50 and 200?

✔️Accepted answer: 
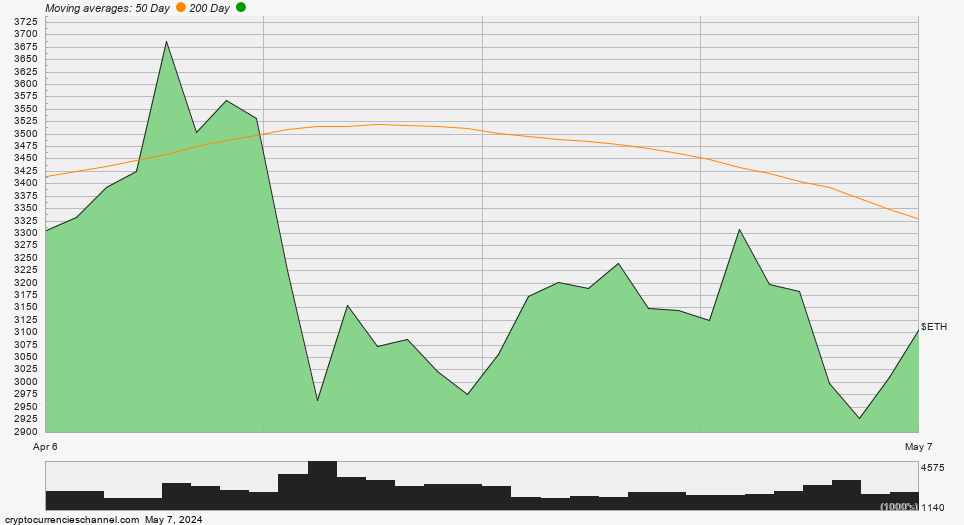
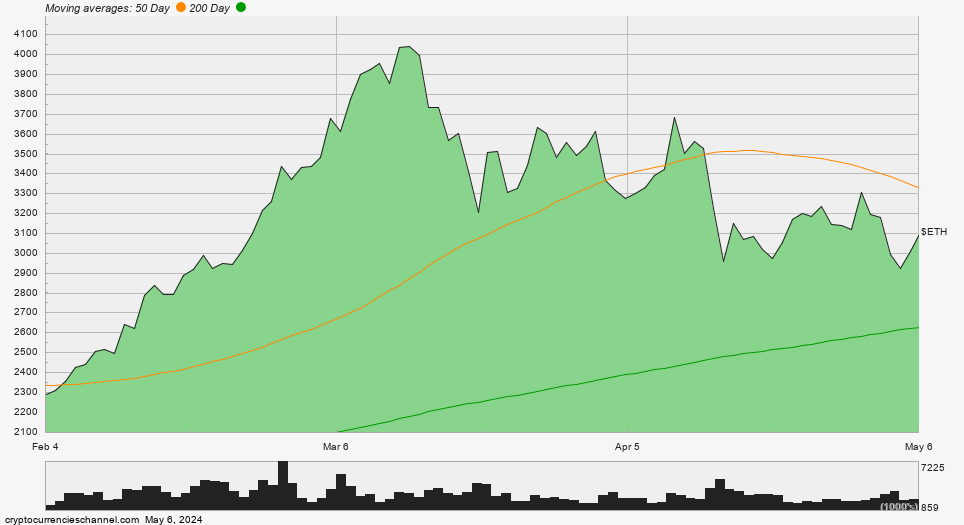
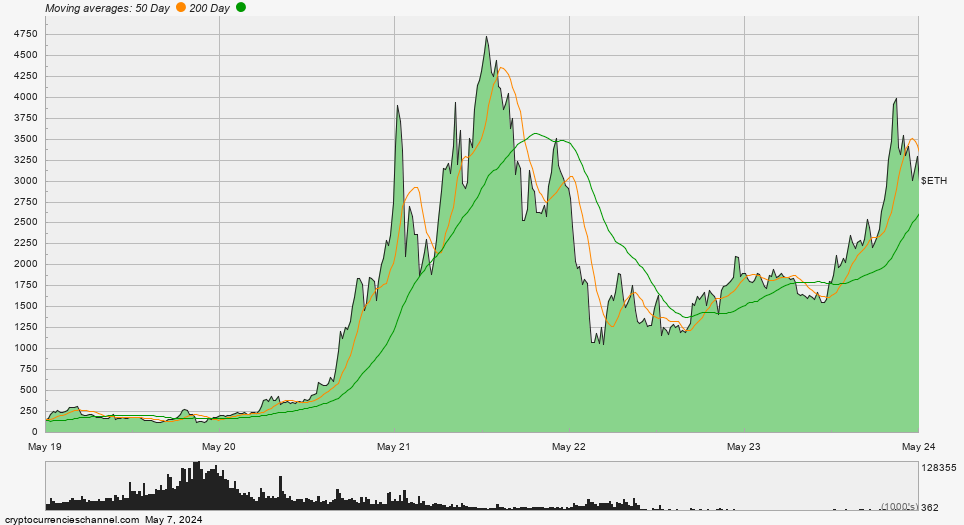
One of the popular technical analysis tools is to calculate a Simple Moving Average (SMA), with a look-back of either a shorter or longer term period — with popular periods being the 50 day moving average ("50 DMA") for the shorter period, and the 200 day moving average ("200 DMA") for the longer period. We calculate the current 50 DMA for Ethereum to be 1678.61, and the current 200 DMA for Ethereum to be 1806.13 as of 9/25/2023.

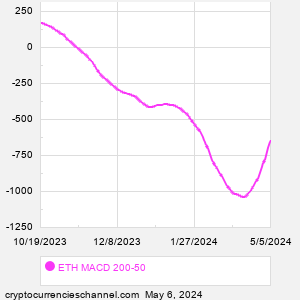
What is Ethereum's MACD based on its DMA values?
MACD referring to the moving average convergence / divergence indicator.

✔️Accepted answer: For the 50 DMA and 200 DMA discussed above, the current MACD is 127.52 based on the Ethereum historical price chart as of 9/25/2023.


Ethereum Historical Price Chart | www.CryptocurrenciesChannel.com | Copyright © 2021 - 2023, All Rights Reserved


Nothing in CryptocurrenciesChannel.com is intended to be investment advice, nor does it represent the opinion of, counsel from, or recommendations by BNK Invest Inc. or any of its affiliates, subsidiaries or partners. None of the information contained herein constitutes a recommendation that any particular security, portfolio, transaction, or investment strategy is suitable for any specific person. All viewers agree that under no circumstances will BNK Invest, Inc,. its subsidiaries, partners, officers, employees, affiliates, or agents be held liable for any loss or damage caused by your reliance on information obtained. By visiting, using or viewing this site, you agree to the following Full Disclaimer & Terms of Use and Privacy Policy. Stock quote data delayed at least 15 minutes; stock quote data powered by Ticker Technologies and Mergent.