Flow Logo Flow Historical Price Chart

Website: https://www.onflow.org/

Description: Flow is a new blockchain built for the next generation of apps, games, and the digital assets that power them. Flow is easy to use and powerful to build with. Every aspect of the platform was designed from the ground up to support exceptional user experience at mainstream scale. Originally conceived by the team behind CryptoKitties, Flow today is a decentralized network supported and built on by a growing community of brands and Web3 builders. Flow’s novel four-node architecture achieves massive improvements in speed and cost that scale with hardware capacity without compromising decentralization or breaking up the network into shards or “layer two” solutions. On this page, we present various Flow historical price chart visualizations.
As of date:11/27/2023
Flow price:0.65
Flow 50 DMA:0.56
Flow 200 DMA:0.56
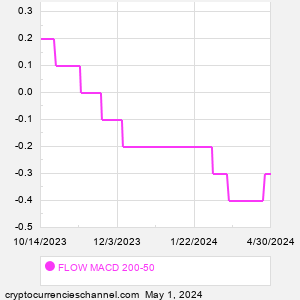
Flow MACD (200-50):0.00
Flow RSI:49.42
Extremely
Overbought
Overbought/Oversold RSI Range
RSI Indicator (Relative Strength Index)49.42
Extremely
Oversold
As of:11/28/2023 10:50EST
Flow price:$0.647980
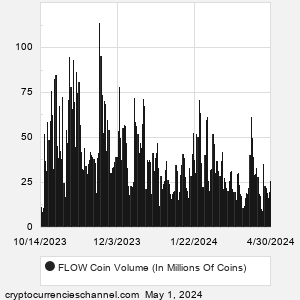
Coin volume:16.44M
Change:+0.001295
%Change:+0.20%
Today's high:$0.650750
Today's low:$0.631709
52 week high:$1.441532
52 week low:$0.413872
Coins outstanding:1.47B
Market cap:953.31M

Flow DMAFlow MACD

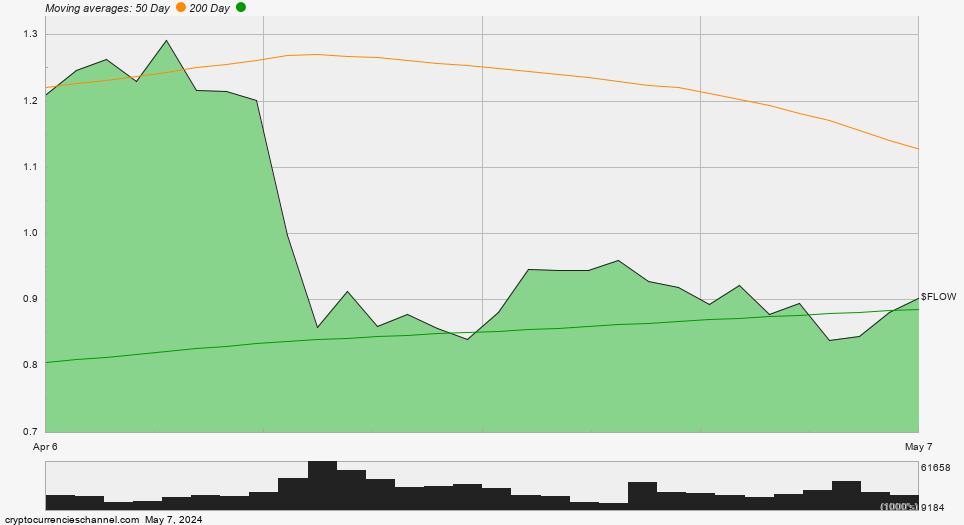
Flow One Month Historical Price Chart

Flow One Month Historical Price Chart

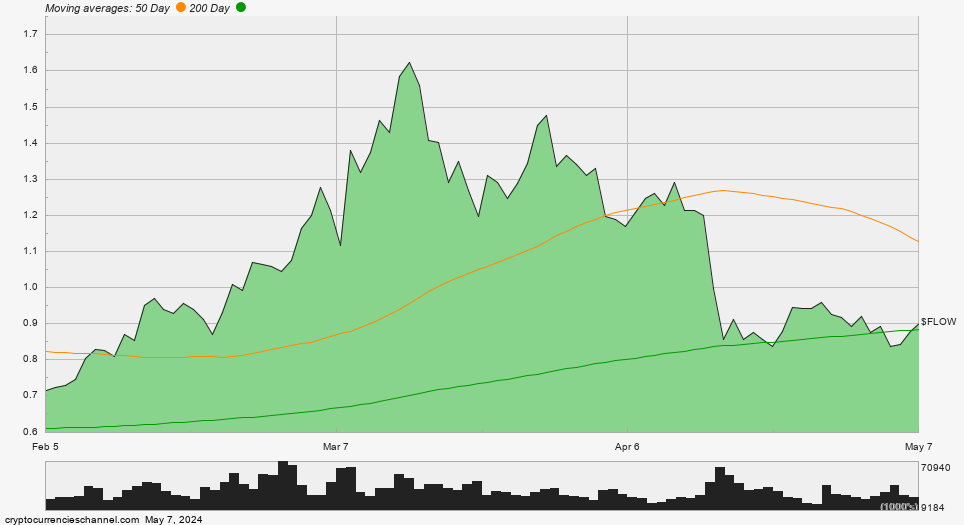
Flow One Quarter Historical Price Chart

Flow One Quarter Historical Price Chart

Flow One Year Historical Price Chart

Flow One Year Historical Price Chart


Featured Crypto Articles

11/28/2023
Buying Power of BNB vs. Netflix at New 52-Week Low

11/28/2023
Comparing BNB Versus Micron Technology Reveals New High

11/28/2023
Comparing BNB Versus Hilton Worldwide Holdings Reveals New High

11/28/2023
BNB vs. Monolithic Power Systems: Price Relationship Crosses Threshold

11/28/2023
BNB Now Buys You the Least Amount of Royal Caribbean Group in the Past Year

11/28/2023
Comparing BNB Versus Howmet Aerospace Reveals New High

11/28/2023
BNB Now Buys You the Least Amount of Garmin in the Past Year

11/28/2023
Comparing BNB Versus Assurant Reveals New High

11/27/2023
BNB vs. Adobe: Price Relationship Crosses Threshold

11/27/2023
Verizon Communications Now the Most Expensive vs. BNB This Year

11/27/2023
BNB Now Buys You the Least Amount of ServiceNow in the Past Year

11/27/2023
Comparing BNB Versus KLA Reveals New High

11/27/2023
Comparing BNB Versus Ross Stores Reveals New High

11/27/2023
W.W. Grainger Now the Most Expensive vs. BNB This Year

11/27/2023
Leidos Holdings Now the Most Expensive vs. BNB This Year

11/27/2023
BNB vs. WR Berkley: Price Relationship Crosses Threshold

11/26/2023
Vanguard Bond Index Funds - Intermediate Term Bond ETF vs. Bitcoin: Price Relationship Crosses Threshold

11/26/2023
Buying Power of Bitcoin vs. iShares Trust - iShares 7-10 Year Treasury Bond ETF at New 52-Week High

11/26/2023
Comparing Bitcoin Versus iShares Trust - iShares MBS ETF Reveals New Low

11/26/2023
Vanguard Scottsdale Funds - Vanguard Short-Term Treasury Index ETF Now the Least Expensive vs. Bitcoin This Year

11/26/2023
Bitcoin Now Buys You the Greatest Amount of iShares Trust - iShares Short Treasury Bond ETF in the Past Year

11/26/2023
Vanguard Sector Index Funds Vanguard Energy ETF Now the Least Expensive vs. Bitcoin This Year

11/26/2023
iShares Trust - iShares Short-Term National Muni Bond ETF Now the Least Expensive vs. Bitcoin This Year

11/26/2023
Buying Power of Bitcoin vs. iShares Trust - iShares 0-5 Year TIPS Bond ETF at New 52-Week High

11/25/2023
Buying Power of Bitcoin vs. Consolidated Edison at New 52-Week High


Recent Flow Related News

11/28 - 10:01 AM
Navigating Crypto's Evolution: Reflections on a Transformative Year and What Lies Ahead

11/28 - 9:10 AM
CFA Institute Launches Cryptoassets Valuation Guide for Investment Professionals

11/28 - 9:06 AM
CFA Institute Launches Cryptoassets Valuation Guide for Investment Professionals

11/28 - 6:46 AM
LBank Labs Winter Bootcamp 2024: The Epicenter of Blockchain Innovation

11/28 - 6:42 AM
LBank Labs Winter Bootcamp 2024: The Epicenter of Blockchain Innovation

11/28 - 5:22 AM
Rad Announces Significant Follow-on Funding from Ayre Ventures & Launch of Video Publishing on BSV Blockchain

11/28 - 2:02 AM
SIX Digital Exchange and DLT Finance Partner to Offer End-to-End Crypto Trading and Custody for Institutional Clients

11/27 - 10:00 AM
Wirex Announces Winners of the 2023 Rising Women in Crypto Power List

11/27 - 8:33 AM
EMURGO Announces Partnership with Institute of Blockchain to Expand Web3 Education Offerings

11/27 - 8:01 AM
BDM DIGITAL: a revolutionary cryptoasset with immediate practical effects

11/27 - 6:06 AM
Kabuni announces Web3 learning platform 'Kabuni Wizard' and Learn-To-Earn Cryptocurrency 'Kabuni Coin'

11/27 - 5:58 AM
Kabuni announces Web3 learning platform 'Kabuni Wizard' and Learn-To-Earn Cryptocurrency 'Kabuni Coin'

11/27 - 5:06 AM
Bybit Launches #High5Bybit Personality Test and 1-million USDT Trading Competition with Exclusive NFT Collection for Fifth Anniversary

11/27 - 5:01 AM
Bybit Launches #High5Bybit Personality Test and 1-million USDT Trading Competition with Exclusive NFT Collection for Fifth Anniversary

11/27 - 4:06 AM
OKX Officially Launches Crypto Exchange and Web3 Wallet in Brazil

11/27 - 4:01 AM
OKX Officially Launches Crypto Exchange and Web3 Wallet in Brazil

11/24 - 9:39 AM
Josh Watkins to Head Blockchain Telecoms Venture Minutes Network as CEO

11/23 - 9:01 AM
BingX Rebrands to Forge Better Crypto Traders

11/23 - 5:01 AM
Global Blockchain Market Report 2023-2028 - Profiles of Key Players IBM, Oracle, Infosys, Wipro, Bitfury and More

11/22 - 5:26 PM
Notice - TROY RICHARD JAMES HOGG, CRYPTOBONTIX INC., ARBITRADE EXCHANGE INC., ARBITRADE LTD., T.J.L. PROPERTY MANAGEMENT INC. and GABLES HOLDINGS INC., File No. 2022-20

11/22 - 5:24 PM
Notice - TROY RICHARD JAMES HOGG, CRYPTOBONTIX INC., ARBITRADE EXCHANGE INC., ARBITRADE LTD., T.J.L. PROPERTY MANAGEMENT INC. and GABLES HOLDINGS INC., File No. 2022-20

11/22 - 8:35 AM
Disrupting Crypto Derivatives with Advanced Analytics Platform: Empowering Traders Through AI

11/22 - 7:21 AM
KPMG in Canada and Chainalysis team up to help organizations combat illicit crypto transactions

11/22 - 7:16 AM
KPMG in Canada and Chainalysis team up to help organizations combat illicit crypto transactions

11/21 - 12:00 PM
Bunzz Launches Hackathon Operation Service Tailored for the Japanese Blockchain and Protocol Project Market


Stocks Versus Digital Assets

Direxion Shares ETF Trust - Daily Semiconductor Bear 3X Shares (SOXS) Vs. Crypto
iShares Trust - MSCI ACWI Low Carbon Target ETF (CRBN) Vs. Crypto
Vanguard Admiral Funds - Vanguard S&P Mid-Cap 400 Value ETF (IVOV) Vs. Crypto
WisdomTree Trust Japan SmallCap Dividend Fund (NTSX) Vs. Crypto
iShares Inc. - iShares MSCI France ETF (EWQ) Vs. Crypto
Ishares U.S. Oil & Gas Exploration & Production ET (IEO) Vs. Crypto
Ishares Trust Ishares U.S. Transportation Etf (IYT) Vs. Crypto


Flow Historical Price Chart FAQ

What is the recent price quote for Flow?
How much is one Flow in US dollars?

✔️Accepted answer: As of 11/27/2023, one coin trades at about 0.65 US dollars for Flow.

Is Flow oversold or overbought?
Using the RSI indicator, where does Flow stand?

✔️Accepted answer: For digital asset traders who incorporate Technical Analysis into their strategies, one of the popular historical price chart tools is the Relative Strength Index (RSI). This popular indicator, originally developed for stock market analysis in the 1970's by J. Welles Wilder, looks at a 14-day moving average of an asset's gains on its up days, versus its losses on its down days. The result is a value that measures momentum, oscillating between "oversold" and "overbought" on a scale of zero to 100. A reading below 30 is viewed to be oversold, which a bullish investor could look to as a sign that the selling is in the process of exhausting itself, and look for entry point opportunities. A reading above 70 is viewed to be overbought, which could indicate that a rally in progress is starting to get crowded with buyers. If the rally has been a long one, that could be a sign that a pullback is overdue. We calculate the current RSI value for Flow to be 49.42 as of 11/27/2023.

What is the current DMA for Flow?
DMA meaning daily moving average, with Flow historical price chart moving average periods of 50 and 200?

✔️Accepted answer: One of the popular technical analysis tools is to calculate a Simple Moving Average (SMA), with a look-back of either a shorter or longer term period — with popular periods being the 50 day moving average ("50 DMA") for the shorter period, and the 200 day moving average ("200 DMA") for the longer period. We calculate the current 50 DMA for Flow to be 0.56, and the current 200 DMA for Flow to be 0.56 as of 11/27/2023.

What is Flow's MACD based on its DMA values?
MACD referring to the moving average convergence / divergence indicator.

✔️Accepted answer: For the 50 DMA and 200 DMA discussed above, the current MACD is 0.00 based on the Flow historical price chart as of 11/27/2023.


Flow Historical Price Chart | www.CryptocurrenciesChannel.com | Copyright © 2021 - 2023, All Rights Reserved


Nothing in CryptocurrenciesChannel.com is intended to be investment advice, nor does it represent the opinion of, counsel from, or recommendations by BNK Invest Inc. or any of its affiliates, subsidiaries or partners. None of the information contained herein constitutes a recommendation that any particular security, portfolio, transaction, or investment strategy is suitable for any specific person. All viewers agree that under no circumstances will BNK Invest, Inc,. its subsidiaries, partners, officers, employees, affiliates, or agents be held liable for any loss or damage caused by your reliance on information obtained. By visiting, using or viewing this site, you agree to the following Full Disclaimer & Terms of Use and Privacy Policy. Stock quote data delayed at least 15 minutes; stock quote data powered by Ticker Technologies and Mergent.