Solana Logo Solana Historical Price Chart

Website: https://solana.com/

Description: Solana is a decentralized blockchain built to enable scalable, user-friendly apps for the world. Solana is the fastest blockchain in the world and the fastest growing ecosystem in crypto, with thousands of projects spanning DeFi, NFTs, Web3 and more. On this page, we present various Solana historical price chart visualizations.
As of date:9/8/2024
Solana price:129.01
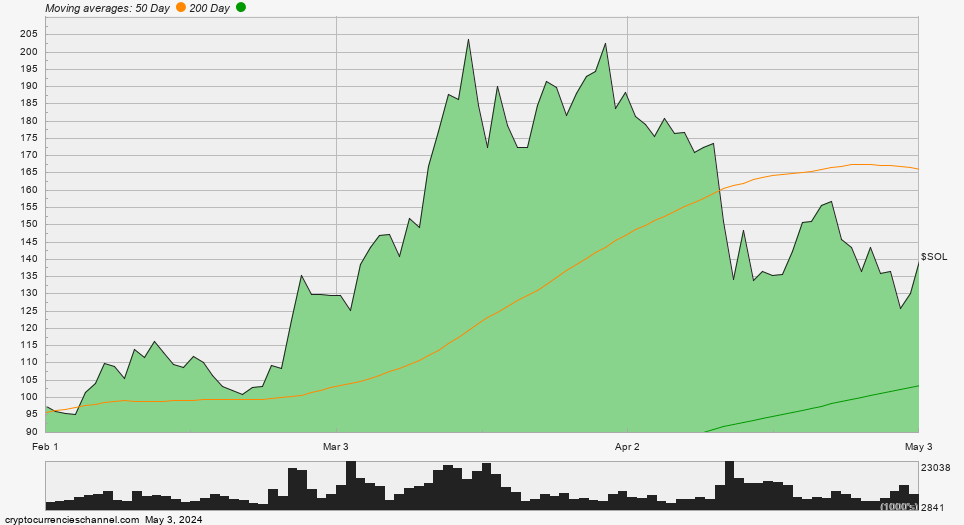
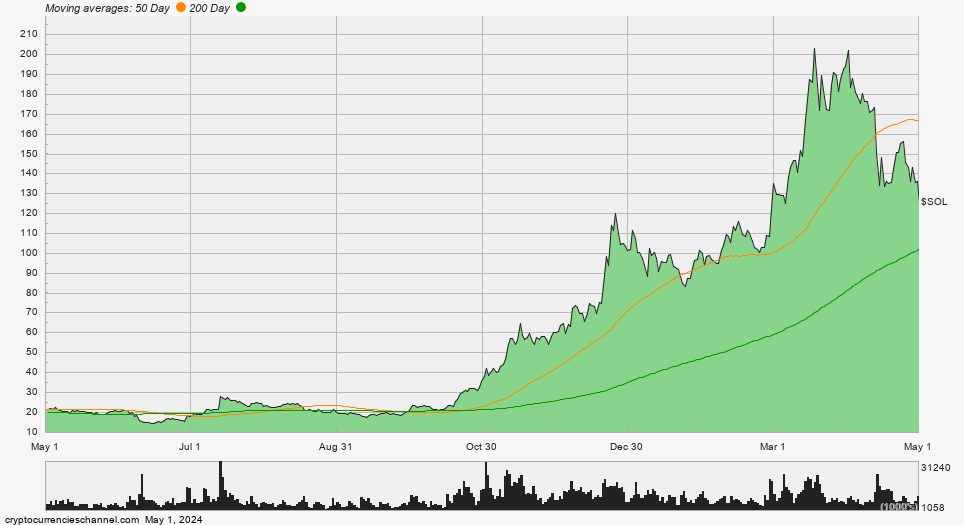
Solana 50 DMA:151.38
Solana 200 DMA:153.22
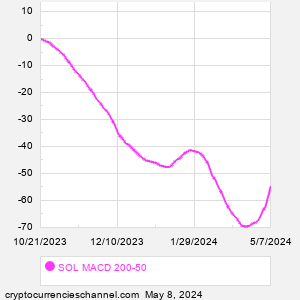
Solana MACD (200-50):1.84
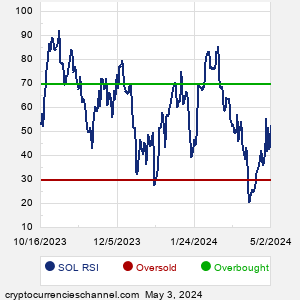
Solana RSI:22.80
Extremely
Overbought
Overbought/Oversold RSI Range
RSI Indicator (Relative Strength Index)22.80
Extremely
Oversold
As of:9/9/2024 10:55EST
Solana price:$127.37
Coin volume:4.12M
Change:-0.78
%Change:-0.61%
Today's high:$130.80
Today's low:$127.37
52 week high:$203.56
52 week low:$18.41
Coins outstanding:467.64M
Market cap:59.56B

Solana DMASolana MACD

Solana One Month Historical Price Chart

Solana One Month Historical Price Chart

Solana One Quarter Historical Price Chart

Solana One Quarter Historical Price Chart

Solana One Year Historical Price Chart

Solana One Year Historical Price Chart


Featured Crypto Articles

9/9/2024
Buying Power of Litecoin vs. Ross Stores at New 52-Week Low

9/9/2024
Litecoin vs. PGandE: Price Relationship Crosses Threshold

9/9/2024
AvalonBay Communities Now the Most Expensive vs. Litecoin This Year

9/9/2024
Litecoin vs. Cardinal Health: Price Relationship Crosses Threshold

9/9/2024
Buying Power of Litecoin vs. Omnicom Group at New 52-Week Low

9/9/2024
Buying Power of Litecoin vs. Baxter Intl at New 52-Week Low

9/9/2024
Litecoin Now Buys You the Least Amount of Insulet in the Past Year

9/9/2024
Buying Power of Litecoin vs. Boston Props at New 52-Week Low

9/8/2024
CME Group Now the Most Expensive vs. Litecoin This Year

9/8/2024
Litecoin Now Buys You the Least Amount of Travelers Companies in the Past Year

9/8/2024
Comparing Litecoin Versus Kenvue Reveals New High

9/8/2024
Litecoin Now Buys You the Least Amount of Clorox in the Past Year

9/7/2024
Ethereum vs. Goldman Sachs Group: Price Relationship Crosses Threshold

9/7/2024
Comparing Ethereum Versus PNC Finl Servs Group Reveals New High

9/7/2024
HCA Healthcare Now the Most Expensive vs. Ethereum This Year

9/7/2024
Ethereum vs. Simon Property Group: Price Relationship Crosses Threshold

9/7/2024
Ethereum Now Buys You the Least Amount of Equifax in the Past Year

9/7/2024
Comparing Ethereum Versus Royal Caribbean Group Reveals New High

9/7/2024
Buying Power of Ethereum vs. Garmin at New 52-Week Low

9/7/2024
Ethereum vs. NVR: Price Relationship Crosses Threshold

9/6/2024
Ethereum Now Buys You the Least Amount of Costco Wholesale in the Past Year


Recent Solana Related News

9/9 - 10:31 AM
WiMi Developed a Blockchain Empowered Asynchronous Federated Learning for Optimizing Model Training

9/9 - 10:25 AM
AEON Debuts its Crypto Payment Solution Initially as a Telegram Bot

9/9 - 9:06 AM
HTX Pioneering P2P Crypto Trading on Telegram with New Mini App, Enjoy Exclusive Perks and Rewards for a Limited Time.

9/9 - 9:06 AM
HTX Pioneering P2P Crypto Trading on Telegram with New Mini App, Enjoy Exclusive Perks and Rewards for a Limited Time.

9/9 - 9:00 AM
Greenidge Provides Bitcoin Production Update and Release of Investor Presentation

9/9 - 8:31 AM
Atomic Partners with Uphold Allowing Crypto Users to Earn 5% Interest on Idle Cash¹

9/9 - 8:06 AM
David Pointcheval, world-renowned Cryptography Researcher, Joins Cosmian as Chief Scientific Officer

9/9 - 8:01 AM
David Pointcheval, world-renowned Cryptography Researcher, Joins Cosmian as Chief Scientific Officer

9/6 - 10:56 AM
aelf and Gaia Join Forces to Host Hello [AI], Celebrating the Convergence of AI and Blockchain

9/6 - 10:53 AM
aelf and Gaia Join Forces to Host Hello [AI], Celebrating the Convergence of AI and Blockchain

9/6 - 10:16 AM
Blockchain Security Market worth $37.4 billion by 2029- Exclusive Report by MarketsandMarkets™

9/6 - 2:57 AM
CoinEx Research: Ethereum and Bitcoin Show Divergent Paths in August's Turbulent Crypto Market

9/5 - 5:56 PM
Blockchain Technology Market to Grow by USD 11.04 Billion from 2023-2027, Driven by Rising Venture Capital Investments, AI-Powered Insights- Technavio

9/5 - 2:41 PM
NeoSwap AI Rebrands as Tulle, Weaving More Liquid Crypto Markets

9/5 - 2:40 PM
NeoSwap AI Rebrands as Tulle, Weaving More Liquid Crypto Markets

9/5 - 9:34 AM
Alchemy Pay Enhances Crypto-Fiat Connectivity on Algorand

9/5 - 9:11 AM
Lambda256 (Nodit) Launches Free Blockchain Analysis Dashboard 'Datasquare'

9/5 - 9:01 AM
Lambda256 (Nodit) Launches Free Blockchain Analysis Dashboard 'Datasquare'

9/5 - 8:55 AM
Buzzmint's Co-founder Highlights How Blockchain Can Solve the Broken Ticketing System After the Oasis Tour Fiasco

9/4 - 10:26 PM
HTX Ventures Invest in Vanilla Finance, Building Telegram DeFi Ecosystem

9/4 - 10:25 PM
HTX Ventures Invest in Vanilla Finance, Building Telegram DeFi Ecosystem

9/4 - 1:37 PM
AXS LAW Expands its Shareholder Rights Practice by Filing a Securities Fraud Class Action Against an International Crypto Bank in the Southern District of New York

9/4 - 11:06 AM
New challenge seeks to tackle online crypto investment fraud with innovation

9/4 - 11:01 AM
New challenge seeks to tackle online crypto investment fraud with innovation

9/4 - 9:05 AM
GONDI V3 Reimagines NFT Lending, Delivering Unmatched Flexibility and Precision


Stocks Versus Digital Assets

Palo Alto Networks (PANW) Vs. Crypto
Gilead Sciences (GILD) Vs. Crypto
Charles Schwab (SCHW) Vs. Crypto
Mondelez International (MDLZ) Vs. Crypto
Southern (SO) Vs. Crypto
Nike (NKE) Vs. Crypto
Starbucks (SBUX) Vs. Crypto


Solana Historical Price Chart FAQ

What is the recent price quote for Solana?
How much is one Solana in US dollars?

✔️Accepted answer: As of 9/8/2024, one coin trades at about 129.01 US dollars for Solana.

Is Solana oversold or overbought?
Using the RSI indicator, where does Solana stand?

✔️Accepted answer: For digital asset traders who incorporate Technical Analysis into their strategies, one of the popular historical price chart tools is the Relative Strength Index (RSI). This popular indicator, originally developed for stock market analysis in the 1970's by J. Welles Wilder, looks at a 14-day moving average of an asset's gains on its up days, versus its losses on its down days. The result is a value that measures momentum, oscillating between "oversold" and "overbought" on a scale of zero to 100. A reading below 30 is viewed to be oversold, which a bullish investor could look to as a sign that the selling is in the process of exhausting itself, and look for entry point opportunities. A reading above 70 is viewed to be overbought, which could indicate that a rally in progress is starting to get crowded with buyers. If the rally has been a long one, that could be a sign that a pullback is overdue. We calculate the current RSI value for Solana to be 22.80 as of 9/8/2024.

What is the current DMA for Solana?
DMA meaning daily moving average, with Solana historical price chart moving average periods of 50 and 200?

✔️Accepted answer: One of the popular technical analysis tools is to calculate a Simple Moving Average (SMA), with a look-back of either a shorter or longer term period — with popular periods being the 50 day moving average ("50 DMA") for the shorter period, and the 200 day moving average ("200 DMA") for the longer period. We calculate the current 50 DMA for Solana to be 151.38, and the current 200 DMA for Solana to be 153.22 as of 9/8/2024.

What is Solana's MACD based on its DMA values?
MACD referring to the moving average convergence / divergence indicator.

✔️Accepted answer: For the 50 DMA and 200 DMA discussed above, the current MACD is 1.84 based on the Solana historical price chart as of 9/8/2024.


Solana Historical Price Chart | www.CryptocurrenciesChannel.com | Copyright © 2021 - 2024, All Rights Reserved


Nothing in CryptocurrenciesChannel.com is intended to be investment advice, nor does it represent the opinion of, counsel from, or recommendations by BNK Invest Inc. or any of its affiliates, subsidiaries or partners. None of the information contained herein constitutes a recommendation that any particular security, portfolio, transaction, or investment strategy is suitable for any specific person. All viewers agree that under no circumstances will BNK Invest, Inc,. its subsidiaries, partners, officers, employees, affiliates, or agents be held liable for any loss or damage caused by your reliance on information obtained. By visiting, using or viewing this site, you agree to the following Full Disclaimer & Terms of Use and Privacy Policy. Stock quote data delayed at least 15 minutes; stock quote data powered by Ticker Technologies and Mergent.