The Graph Logo The Graph Historical Price Chart

Website: https://thegraph.com/en/

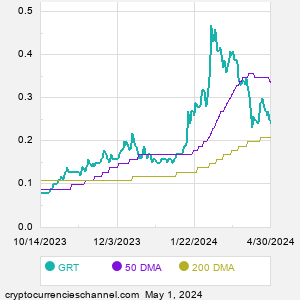
Description: The Graph is an indexing protocol for querying networks like Ethereum and IPFS. Anyone can build and publish open APIs, called subgraphs, making data easily accessible. On this page, we present various The Graph historical price chart visualizations.
As of date:4/24/2024
The Graph price:0.27
The Graph 50 DMA:0.35
The Graph 200 DMA:0.21
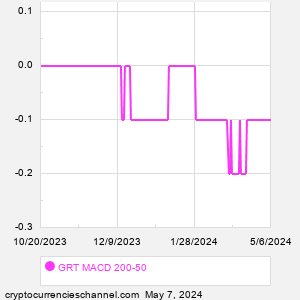
The Graph MACD (200-50):-0.14
The Graph RSI:38.77
Extremely
Overbought
Overbought/Oversold RSI Range
RSI Indicator (Relative Strength Index)38.77
Extremely
Oversold
As of:4/27/2024 0:05EST
The_Graph price:$0.260525
Coin volume:109.94M
Change:-0.006863
%Change:-2.57%
Today's high:$0.260585
Today's low:$0.259858
52 week high:$0.474124
52 week low:$0.079235
Coins outstanding:9.48B
Market cap:2.47B

The Graph DMAThe Graph MACD

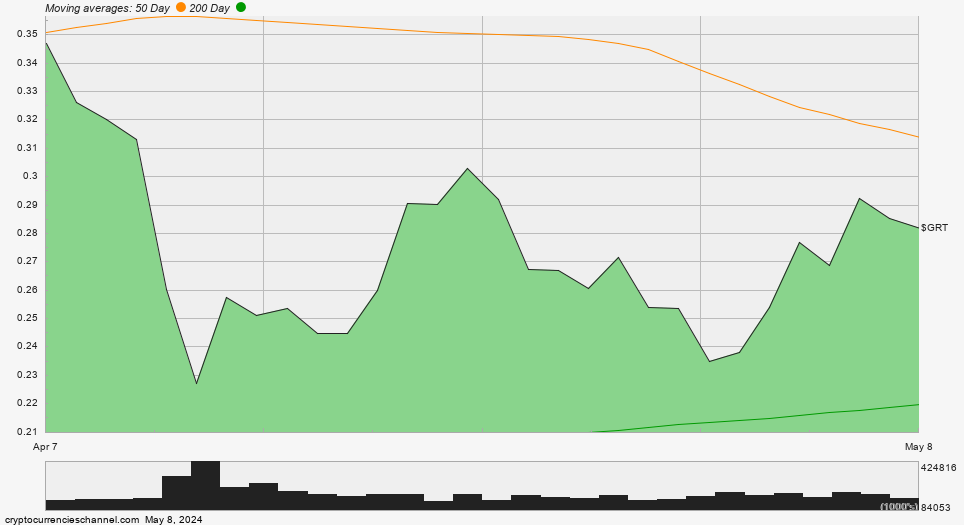
The Graph One Month Historical Price Chart

The Graph One Month Historical Price Chart

The Graph One Quarter Historical Price Chart

The Graph One Quarter Historical Price Chart

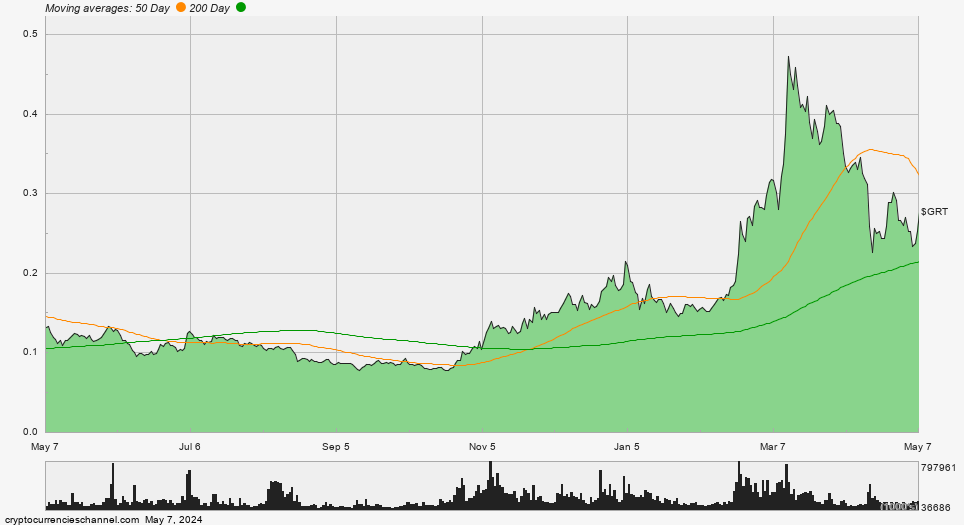
The Graph One Year Historical Price Chart

The Graph One Year Historical Price Chart


Featured Crypto Articles

4/25/2024
XRP vs. Westinghouse Air Brake: Price Relationship Crosses Threshold

4/25/2024
BNB Now Buys You the Greatest Amount of Gilead Sciences in the Past Year

4/25/2024
BNB Now Buys You the Greatest Amount of Simon Property Group in the Past Year

4/25/2024
Buying Power of BNB vs. Otis Worldwide at New 52-Week High

4/25/2024
BNB Now Buys You the Greatest Amount of Vulcan Materials in the Past Year

4/25/2024
Buying Power of BNB vs. Dollar Tree at New 52-Week High

4/25/2024
BNB Now Buys You the Greatest Amount of Zimmer Biomet Holdings in the Past Year

4/25/2024
Comparing BNB Versus eBay Reveals New Low

4/25/2024
Buying Power of BNB vs. Broadridge Financial Soln at New 52-Week High

4/24/2024
Boeing vs. BNB: Price Relationship Crosses Threshold

4/24/2024
BNB Now Buys You the Greatest Amount of Cadence Design Sys in the Past Year

4/24/2024
Fastenal vs. BNB: Price Relationship Crosses Threshold

4/24/2024
Buying Power of BNB vs. Ameriprise Finl at New 52-Week High

4/24/2024
Comparing Bitcoin Versus MSCI Reveals New Low

4/24/2024
BNB Now Buys You the Greatest Amount of CoStar Group in the Past Year

4/24/2024
Buying Power of BNB vs. Cognizant Tech Solns at New 52-Week High

4/24/2024
Comparing BNB Versus Dollar Gen Reveals New Low


Recent The Graph Related News

4/26 - 10:12 AM
Marathon Digital Holdings Engages TaxBit To Support Crypto Accounting Needs

4/26 - 8:56 AM
Bitrue Leads the Industry with First Listing of Bitcoin Runes Tokens

4/26 - 8:55 AM
Bitrue Leads the Industry with First Listing of Bitcoin Runes Tokens

4/26 - 7:01 AM
Hedera and Blockchain Foundation Initiative Spotlights Efforts by National Institutions to Advance Responsible Innovation in Web3

4/26 - 5:29 AM
London Blockchain Conference Launches the No Future Campaign

4/25 - 2:22 PM
Consensys sues the SEC in defense of the Ethereum ecosystem

4/25 - 12:01 PM
Revolutionizing E-Commerce and Cryptocurrency Integration: $2 Million Seed Funding Secured by Moso

4/25 - 11:06 AM
Movement Labs Raises $38 Million in Series A to Bring Facebook's Move to Ethereum

4/25 - 11:01 AM
Movement Labs Raises $38 Million in Series A to Bring Facebook's Move to Ethereum

4/25 - 10:27 AM
XION Pioneers User-Friendly Blockchain Solutions with Latest Chain Abstraction Release

4/25 - 8:01 AM
Flash News: OKX Ventures Announces Series A Round Investment for Movement, the First Ethereum MoveVM Layer 2 Network

4/25 - 7:31 AM
Kore Digital Mining Ltd Announces Additional 14 PH/s Bitcoin Mining Capacity.

4/25 - 6:01 AM
Roundhill Bitcoin Covered Call Strategy ETF (YBTC) Declares April Distribution

4/25 - 1:00 AM
Flash News: OKX Wallet Now Integrated with XION, a User-First Layer 1 Blockchain

4/24 - 9:28 PM
Flash News: OKX DeFi Launches 'zkSwap Bonus Event' Offering Users the Opportunity to Earn a Bonus APR

4/24 - 10:50 AM
Venom Blockchain and United Network Forge Strategic Partnership to Power Next-Generation Payment Systems

4/24 - 10:06 AM
BitIRA Launches Self-Service Bitcoin IRA Platform

4/24 - 10:00 AM
Strike Launches Bitcoin App in Europe

4/24 - 8:49 AM
Northstake and Kvarn Capital launch Ethereum staking services on Kvarn X

4/24 - 7:06 AM
Canada's investment sector (re)embraced cryptoassets in 2023, new poll shows

4/24 - 7:01 AM
Canada's investment sector (re)embraced cryptoassets in 2023, new poll shows

4/24 - 6:46 AM
Blockchain Market to Expand at 80.8% CAGR through 2031 | SkyQuest Technology

4/23 - 11:21 AM
Epazz, Inc.: CryObo, Inc. solar Bitcoin operations will issue tokens

4/22 - 3:01 PM
On Earth Day, Mysten Labs Joins With Industry Luminaries Proposing Novel Use of Blockchain Technology to Preserve Global Biodiversity

4/22 - 11:05 AM
Umoja Integrates Portal DeFi Enabling Trustless Swapping of Lower Risk, Higher Yield Assets on Bitcoin


Stocks Versus Digital Assets

Spdr Standard and Poors Global Natural Resources Etf (GNR) Vs. Crypto
ProShares Ultrapro Short QQQ (SQQQ) Vs. Crypto
Invesco Bulletshares 2026 Corporate Bond Etf (BSCQ) Vs. Crypto
Invesco Aerospace & Defense Etf (PPA) Vs. Crypto
First Trust Cloud Computing Etf (SKYY) Vs. Crypto
Blackrock Short Duration Bond Etf (NEAR) Vs. Crypto
Vaneck Fallen Angel High Yield Bond Etf (ANGL) Vs. Crypto


The Graph Historical Price Chart FAQ

What is the recent price quote for The Graph?
How much is one The Graph in US dollars?

✔️Accepted answer: As of 4/24/2024, one coin trades at about 0.27 US dollars for The Graph.

Is The Graph oversold or overbought?
Using the RSI indicator, where does The Graph stand?

✔️Accepted answer: For digital asset traders who incorporate Technical Analysis into their strategies, one of the popular historical price chart tools is the Relative Strength Index (RSI). This popular indicator, originally developed for stock market analysis in the 1970's by J. Welles Wilder, looks at a 14-day moving average of an asset's gains on its up days, versus its losses on its down days. The result is a value that measures momentum, oscillating between "oversold" and "overbought" on a scale of zero to 100. A reading below 30 is viewed to be oversold, which a bullish investor could look to as a sign that the selling is in the process of exhausting itself, and look for entry point opportunities. A reading above 70 is viewed to be overbought, which could indicate that a rally in progress is starting to get crowded with buyers. If the rally has been a long one, that could be a sign that a pullback is overdue. We calculate the current RSI value for The Graph to be 38.77 as of 4/24/2024.

What is the current DMA for The Graph?
DMA meaning daily moving average, with The Graph historical price chart moving average periods of 50 and 200?

✔️Accepted answer: One of the popular technical analysis tools is to calculate a Simple Moving Average (SMA), with a look-back of either a shorter or longer term period — with popular periods being the 50 day moving average ("50 DMA") for the shorter period, and the 200 day moving average ("200 DMA") for the longer period. We calculate the current 50 DMA for The Graph to be 0.35, and the current 200 DMA for The Graph to be 0.21 as of 4/24/2024.

What is The Graph's MACD based on its DMA values?
MACD referring to the moving average convergence / divergence indicator.

✔️Accepted answer: For the 50 DMA and 200 DMA discussed above, the current MACD is -0.14 based on the The Graph historical price chart as of 4/24/2024.


The Graph Historical Price Chart | www.CryptocurrenciesChannel.com | Copyright © 2021 - 2024, All Rights Reserved


Nothing in CryptocurrenciesChannel.com is intended to be investment advice, nor does it represent the opinion of, counsel from, or recommendations by BNK Invest Inc. or any of its affiliates, subsidiaries or partners. None of the information contained herein constitutes a recommendation that any particular security, portfolio, transaction, or investment strategy is suitable for any specific person. All viewers agree that under no circumstances will BNK Invest, Inc,. its subsidiaries, partners, officers, employees, affiliates, or agents be held liable for any loss or damage caused by your reliance on information obtained. By visiting, using or viewing this site, you agree to the following Full Disclaimer & Terms of Use and Privacy Policy. Stock quote data delayed at least 15 minutes; stock quote data powered by Ticker Technologies and Mergent.